
The Africa Youth Employment Clock (AYEC)
Methodology Overview
The Africa Youth Employment Clock (AYEC) monitors and projects employment trends
at both national and subnational levels. It focuses on the working-age population
(ages 15–64), with particular emphasis on youth aged 15–35, in line with the African
Union’s definition.
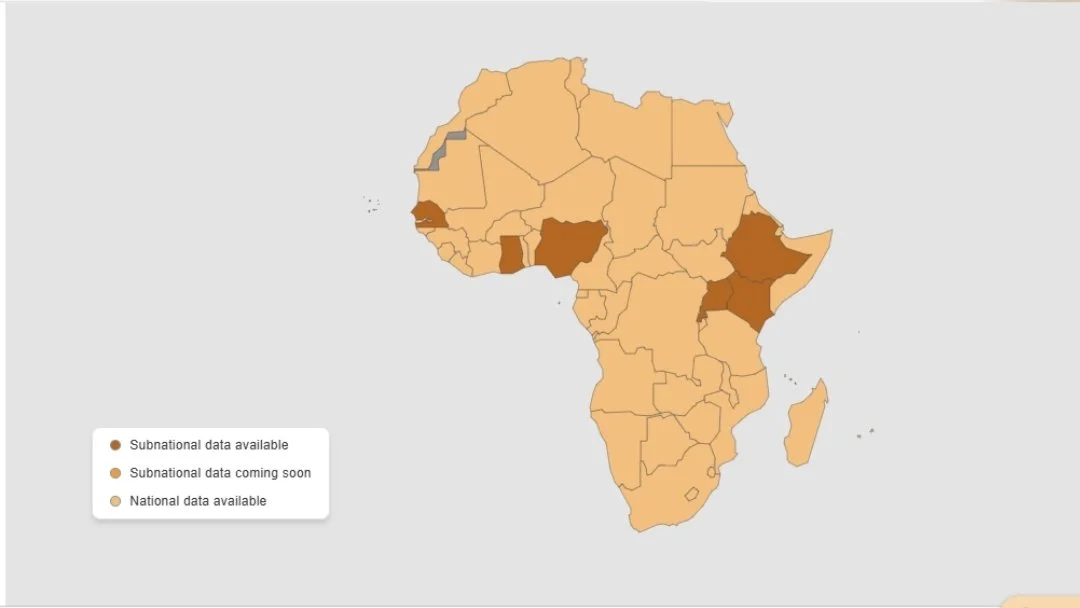
Data Coverage:
National Data: Available for all 54 African countries
Subnational Data: Currently available for Kenya, Rwanda, Ghana, Nigeria,
Uganda, Ethiopia, and Senegal. The Clock plans to expand subnational data
coverage to include the West African Economic and Monetary Union (WAEMU)
over time.
The Clock's analytical model delivers reliable youth employment estimates,
disaggregated by numerous variables including: labor force status, gender, age,
educational attainment, sector, job formality, urban/rural status, and working poverty.
The Clock's methodology, developed in collaboration with academic partners at the
University of Cape Town (UCT) and the University of Oxford, leverages surveys and
datasets from national statistics offices, the International Labour Organization (ILO),
and the International Institute for Applied Systems Analysis (IIASA).
This approach models historical data trends, incorporating projections for population
growth, educational attainment, and anticipated economic conditions (specifically,
GDP per capita growth rates) to forecast national-level data up to 2040. The core
assumption is that demographic and employment trends will follow established
historical patterns and projected economic trajectories.
WDL ensures consistency and comparability across countries by employing these
robust modeling techniques. Subnational estimates are rescaled to align with the
national-level data. The methodology relies on the best available data, is regularly
updated with new releases from the aforementioned sources, and is designed to
provide reliable estimates.
For questions regarding our methodology, please feel free to contact
hello@worlddata.io
National level estimates
To align national and international data sources and definitions, our methodology
focuses on three main elements, detailed below:
Integrating Estimates
Forecasting
Data Harmonization
Integrating Estimates: A Complete Set of Disaggregated National Data
Our objective in this project is to obtain a complete set of disaggregated data for
each country, in each year, and grouped by labor force status - employed,
unemployed, inactive, student (in education or training), and disaggregated numerous variables including: age, gender, educational attainment, sector, job
formality, urban/rural status, and working poverty.In this first step, we combine three different datasets:
a. National level labor force rates and shares disaggregated by age groups, gender,
and education attainment levels.b. Employment shares by economic activity (sectors), by age groups, gender, and
education attainment levels.c. Additional datasets on working poverty, urban/rural, formality and
self-employment.d. National level absolute population numbers from International Institute for
Applied Systems Analysis (IIASA).We first interpolate IIASA’s 5-year estimates using Sprague (osculatory) multipliers to
receive single-age population for each year disaggregated by gender and education
level attainment (Sprague, 1880). We then apply ILO’s unemployment, NEET (Not in
Employment, Education or Training), and inactivity (out of labor force) shares to the
population data. To be specific, we first recover the population in the labor force
using the inactivity (out of labor force) share. Then, we calculate the number of
employed/unemployed by using the unemployment rate on the population in the
labor force. Finally, we compute students as residuals of the employed and the NEET
out of the total population. The rest of the population (after applying final employed,
unemployed, and student shares) are referred to as “inactive”, which due to our
separate student category is somewhat more narrowly defined than in most ILO
statistics. Whenever it was necessary to make use of a particular definition of labor
market indicators, we followed ILOSTAT’s guidelines.The core objective of this project is to generate a comprehensive set of disaggregated
labor market data for every country and year. This data will be segmented by five
labor force statuses—employed, unemployed, inactive, student (in education or
training)—and further disaggregated by numerous variables including age, gender,
educational attainment, sector, job formality, urban/rural status, and working poverty.The methodology begins by integrating four distinct datasets:
National-level labor force rates and shares, disaggregated by age groups,
gender, and education attainment levels.Employment shares by economic activity (sectors), broken down by age groups,
gender, and education attainment levels.Supplemental datasets covering working poverty, urban/rural status, formality,
and self-employment.National-level absolute population numbers from the International Institute for
Applied Systems Analysis (IIASA).
Our first step is to interpolate IIASA’s five-year population estimates using Sprague
(osculatory) multipliers to generate annual single-age population estimates,
disaggregated by gender and educational attainment (Sprague, 1880). We then apply
ILO estimates of unemployment, NEET (Not in Employment, Education or Training),
and inactivity (out of the labor force) to these population data.Specifically, we first derive the size of the labor force by applying the inactivity share
to the total population. We then estimate the numbers of employed and unemployed
individuals by applying the unemployment rate to the labor force. Finally, the student
population is calculated as the residual of the employed and NEET categories from
the total population. Students are excluded from the inactive category; as a result,
our definition of inactivity is narrower than that used in most ILO statistics, reflecting
the explicit separation of students. We adhere to ILOSTAT’s guidelines for labor
market indicator definitions whenever necessary.Finally, once these groups are calculated, we further disaggregate the employed
population into the sectors. Additional data sets on formality of employment, working
poverty, self-employment and urban/rural employment rates are estimated and
incorporated into the clock.
2. Forecasting disaggregated numbers up to 2040
Following forecasting approaches used by, for example, ILO’s Employment Trends
Unit⁴ and Huruta, A. D. (2024), we project unemployment, inactivity, and NEET shares.
Our projections exploit the relationship between these indicators and GDP per capita.
Specifically, we employ an ARIMAX (Autoregressive Integrated Moving Average with an
eXogenous Regressor) model,⁵ which predicts changes in these rates based on their
historical dynamics and the influence of GDP per capita growth.
We use lagged shares and GDP growth rates because they capture the fundamental
empirical regularity that labor market outcomes are strongly shaped by both their
own momentum (persistence in unemployment and inactivity patterns) and the pace
of economic expansion, which directly drives job creation and labor force
participation.
Among a range of alternative specifications evaluated, the ARIMAX model delivered
the best (pseudo) out-of-sample performance as measured by the Root Mean
Squared Error (MSE).
We leverage two pre-existing data sources to obtain population and GDP per capita
forecasts used in the Africa Youth Employment Clock (AYEC).
a. Youth population projections disaggregated by single year of age, gender, and
educational attainment up to 2040 are sourced from the International Institute
for Applied Systems Analysis (IIASA).
b. GDP per capita growth rate forecasts are constructed by combining short- and
medium-term projections from the International Monetary Fund’s (IMF) World
Economic Outlook (WEO, latest edition: January 2026) with long-run growth
projections from IIASA’s Shared Socioeconomic Pathways, specifically the SSP2
(“middle-of-the-road”) scenario. The IMF WEO provides real GDP growth
forecasts up to five years ahead (through 2027 in the latest edition), reflecting
current macroeconomic conditions, policy responses, and business-cycle
dynamics, while IIASA SSP2 provides long-run projections up to 2100 driven by
structural factors such as demographic change, education expansion, and
economic development. For the period 2025–2030, we rely exclusively on IMF
WEO growth rates. Beyond this horizon, GDP per capita growth rates are
extended following Cuaresma, J. C. (2017), using a parsimonious production-function framework in which human capital is the main long-run
growth driver. For the transition period 2031–2040, we compute a weighted
average of IMF WEO and IIASA growth rates, assuming constant post-2030 IMF
growth, and apply a smoothing procedure around the transition years to ensure
a gradual and plausible shift from short-term to long-term projections.
IMF WEO data are updated quarterly, whereas IIASA GDP projections do not follow a
fixed update schedule. As in previous datasets, revisions to IMF WEO forecasts are
primarily driven by new official macroeconomic data releases, GDP rebasing exercises,
and revisions to historical national accounts.
3. Harmonizing subnational surveys
Data Harmonization aims to ensure consistency and comparability in
subnational-level data across the countries with subnational data. This is achieved by
integrating national survey microdata with subnational information while preserving
the original data as closely as possible. Country-specific education and sector
classifications are aggregated into internationally comparable groupings, and
population estimates are scaled proportionally and iteratively to ensure alignment
with the aggregate results described in step (i).
Data sources
Source data for Rwanda were labor force surveys from the National Institute of
Statistics of Rwanda (NISR) covering the period 2017–2024. For Kenya, we accessed
labor market data from the Kenya Population and Housing Census (2019) and labor
force surveys for the years 2019–2022, produced by the Kenya National Bureau of
Statistics (KNBS).
In Nigeria, labor market indicators were derived from the National Labour Force
Survey conducted by the National Bureau of Statistics (NBS) for the years 2022–2024.
For Ghana, we relied on multiple sources, including the Annual Household Income and
Expenditure Survey (AHIES, 2022–2024), the Population and Housing Census (2010 and
2021), and the Ghana Living Standards Survey (2017), all produced by the Ghana
Statistical Service (GSS).
For Ethiopia, labor market data were obtained from national Labour Force Surveys
conducted by the Central Statistical Agency (CSA) in 2005, 2013, and 2021. In Uganda,
available sources include Labour Force Surveys from 2012, 2017, and 2021, as well as
Population and Housing Censuses from 2014 and 2024.
Finally, for Senegal, we used data from the Labour Force Survey (2017–2024) and the
Household Living Conditions Survey (2018–2021/2022), produced by the Agence
Nationale de la Statistique et de la Démographie (ANSD). Subnational data are
available for all countries, and a harmonized methodology is applied across datasets
to ensure comparability.
A data processing and harmonization step is implemented to ensure that variables
are consistently structured and aligned with standardized definitions (see Glossary of
Terms). This harmonization is conducted in a manner that preserves data integrity,
following a systematic validation process that includes checks on both input data and
resulting outputs.
Forecasting
Following data processing and harmonization, subnational projections are generated
using multi-year survey data, disaggregated by key breakdown categories (age, gender,
education, sector, etc.). An Auto-ARIMA modeling framework is applied, enabling the
automatic selection of optimal model specifications based on validation against
observed historical data. These models are then used to estimate and project trends
within each disaggregated subgroup.
A subsequent rescaling step is implemented to ensure consistency between
national-level aggregates and the corresponding subnational estimates. This
adjustment preserves the relative distribution across subnational units and
disaggregated categories while enforcing coherence with nationally observed and
projected totals.
Data interpretation: Assumptions and limitations
In some cases, labor force indicators were only available for broad age groups (15–24
and 25+ years), requiring an explicit methodological choice to estimate outcomes for
youth aged 25–35. In the initial version of the Africa Employment Clock, we therefore
assumed that rates observed for the 25+ population also apply to individuals aged
25–35 where more granular data were unavailable.
For NEET shares, we adopted a different approach by leveraging age-specific patterns
observed in household survey data from all the 7 countries with subnational data
mentioned above. Specifically, we calculated the median ratio between NEET rates for
ages 15–24 and 25–35 in these countries and applied this ratio to estimate NEET
shares for the 25–35 age group in other countries.
We acknowledge that these assumptions may have a material impact on the resulting
estimates. Improving age-disaggregated coverage remains a priority, and we are
actively working to incorporate more detailed source data for the target age range as
it becomes available.
Missing values in national-level data, arising primarily from irregular survey coverage,
were addressed using a combination of linear interpolation, regional averages, and
forward or backward filling. The choice of imputation method depended on the
structure and availability of the underlying data, with methods selected to best
preserve observed trends and cross-country consistency in each case.
For subnational microdata, missing observations were handled using linear
interpolation for gaps over time, and Multivariate Imputation by Chained Equations
(MICE) for variables with cross-sectional missingness.
Additional limitations stem from the underlying source data used in the Africa
Employment Clock. World Data Lab draws on multiple international data providers,
including ILO modeled estimates, IIASA population projections, and IMF GDP
forecasts. As a result, the assumptions, methodologies, and limitations documented
by these institutions also apply to the indicators presented in this tool. Users are
encouraged to consult the methodological documentation of ILO and IIASA for further
details on the underlying data sources.